Press "Enter" to skip to content

Category: Visualization

Tools and Tips for Accessibility

Daron Yöndem shares insights:

Last week, as a new employee, I went through Microsoft’s internal employee learning portal and found the Accessibility 101 online course. To my surprise, the course did have a good amount of practical information and connected the concept of accessibility nicely to inclusion and diversity. In this post, I want to share a couple of the practical steps to help you step up your accessibility game. If you are where I was, I’m sure you will love these.

Click through for some easy ways to improve presentations and webpages. Most of this is a few minutes’ worth of effort but can pay dividends. On a side note, congrats to Daron for the Microsoft gig. I enjoyed working with him in the past and know he’ll do great there.

Comments closed

Dynamic Transparency Changes in Power BI

Sandeep Pawar explains how to allow users to control transparency in Power BI visuals:

As someone who uses Python/R heavily for exploratory data analysis and Power BI for publishing the final data analytics reports, I have always missed the ability to adjust the color transperancy in Power BI. In Power BI you can change the color dynamically and conditionally but there is no native functionality to change the transperancy.

I was working on a project where I wanted to highlight certain clusters in the data to the business user. Sure, I could change the color but it’s very challenging when the data points are concentrated in a small area and they overlap each other. In Python and R you can easily adjust the alpha value in most plots to see the dense area clearly.

Click through for one Power BI solution.

Comments closed

Adding Report Names to the Log Analytics Report

Gilbert Quevauvilliers feels complete:

I was really excited to use the Power BI Log Analytics for Analysis Services Engine report when it was released along with this blog post from the Power BI Team: Announcing long-term usage and performance insights (Public Preview) | Microsoft Power BI Blog | Microsoft Power BI

This is really a great report when using Log Analytics.

I found the one thing that I wanted to view was my report names. The standard report did not have this.

Protip: displaying GUIDs is not the same as displaying useful information. I recommend reading through this just to see how much pain and effort it takes to make the Log Analytics report actually become useful.

Comments closed

Using Radar Charts

Mike Cisneros explains what radar (or spider) charts are and how they work:

A spider chart, also sometimes called a radar chart, is often used when you want to display data across several unique dimensions. Although there are exceptions, these dimensions are usually quantitative, and usually range from zero to a maximum value. Each dimension’s range is normalized to one another, so that when we draw our spider chart, the length of a line from zero to a dimension’s maximum value will be the same for every dimension.

Spider charts can be found in lots of industries, but rarely in large numbers. In our experience, they’re most likely to pop up in food science (comparing products across multiple different facets of taste, texture, etc.) and in sports analytics (comparing athletes across several dimensions of performance). In one of our previous #SWDchallenges, several participants found other use cases for spider charts, such as comparing series on a time-cycle, comparing the volume of searches for different terms, or even visualizing the motifs in a piece of music.

My favorite use of the radar chart was in the Madden NFL series, where I spent far too much of my youth comparing attributes between prospects—for example, the quarterback radar chart might have throwing power, throwing accuracy, speed, strength, and awareness. Then, you compare the relative sizes and spikes of players to gauge who would be better. (Except that in the case of Madden, it was all a lie—turns out the radar charts weren’t actually based on anything, so as usual, a youth wasted).

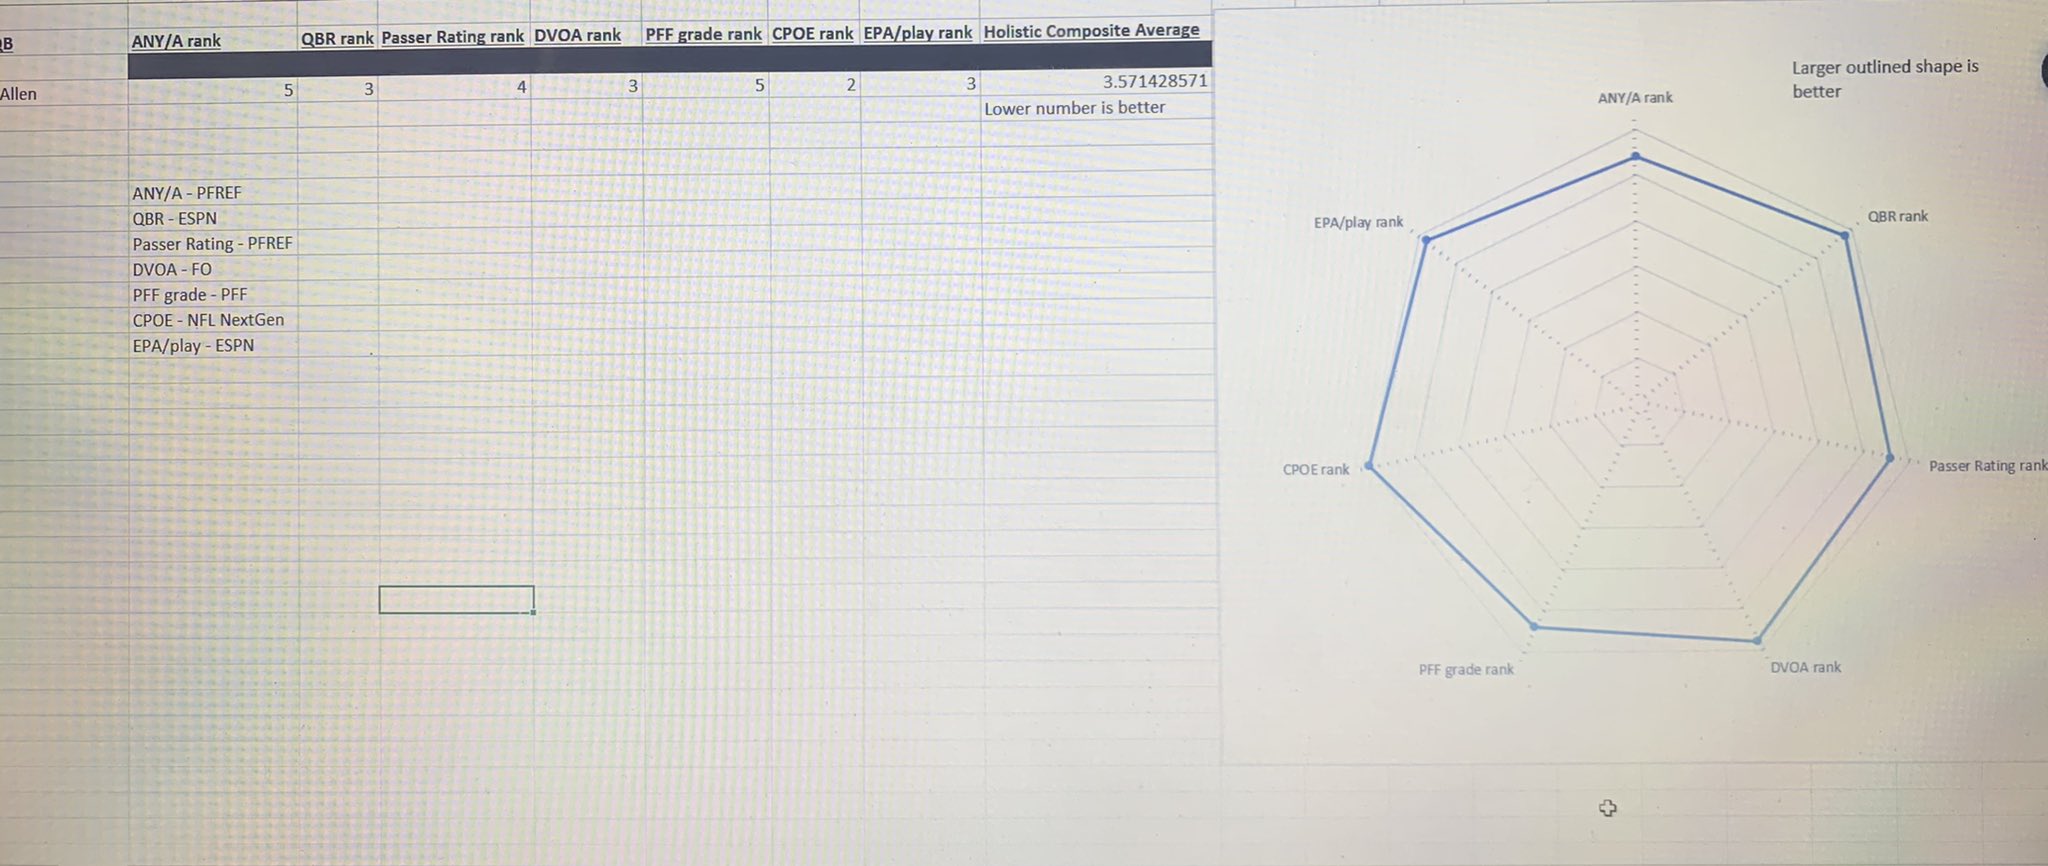
More recently, Bruce Nolan came up with a radar chart to visualize quarterback play across a set of complementary measures:
Image
Comments closed

Making a Column Chart Better

Meagan Longoria improves a visual:

There are some easy opportunities to improve the readability of this chart, so I thought I would use it as an example of how small improvements can have a big impact on a fairly simple chart. I recreated the chart (as best I could) in Power BI and then made two revised versions.

Read on to see what Meagan did and get some advice on the subject.

Comments closed

The Benefits of Dot Plots

Alex Velez shows off two powerful forms of dot plots:

Unfortunately, many graphing tools don’t include dot plots in their default charting options—including Excel, my preferred graphing tool. To build a dot plot in Excel, you need to get creative and format an existing chart to present as a dot plot. 

It sounds like some sort of wizardry, yet hopefully, this article will take the magic out of the process, enabling you to build dot plots and other custom creations.

Click through for a step-by-step walkthrough of how to create dot plots in Excel. Unfortunately, it’s not that much better in Power BI.

Comments closed

Visualizing Data over Time with F#

Codesuji takes us through creating an interesting video:

How is this accomplished? I reach into F#’s bag of tricks to leverage Deedle, Plotly.NET, and ffmpeg in order to transform a series of data files into a singular video showing county-level drought data from 1900-2016. Together these bring static data into a dynamic representation. For reference, the Palmer Drought Severity Index (PDSI) typically ranges from -10 (dry) to 10 (wet). Putting this all together is pretty straight-forward, but I wanted to call out a couple specific parts. For this particular example Deedle is overkill, but pairing it with Plotly.NET can often be useful in more complex situations. Plotly offers some nice customization options, which I take advantage of below. Once all the images are generated with Plotly, F# can shell out to ffmpeg to perform the video assembly. I do this in two parts, creating both an mp4 and webm file.

We’re reading datasets, parsing text files, deserializing JSON contents, building a visual for each point in time, and then creating a video out of it—all in 100 lines of code. Not bad.

Comments closed

Conditional Visibility in Power BI Paginated Reports

Sabrina Jordan has a clever solution to a common customer request:

How many times have you struggled to find the happy medium between a report that looks phenomenal when printed, but has everything a user might need in an Excel export? I recently built a beautiful paginated report with groupings separated by white space for easy readability – but the user wanted to export the results to Excel, and the format prevented them from sorting or filtering the report contents. Power BI Report Builder has a couple features that can allow you the best of both worlds, with a few simple tricks. By the end of this tutorial, you will have created two Tablix, set up conditional visibility based on report render format, and set conditional sizing on the Excel Tablix (using hidden charts!) to prevent blank pages.

Click through for the solution.

Comments closed

Font Choices with ggplot2

Kenneth Tay takes us through font options in R’s ggplot2 package:

I was recently asked to convert all the fonts in my ggplot2-generated figures for a paper to Times New Roman. It turns out that this is easy, but it brought up a whole host of questions that I don’t have the full answer to.

If you want to go all out with using custom fonts, I suggest looking into the extrafont and showtext packages. This post will focus on what you can do without importing additional packages.

A quick word of warning: R’s behavior with respect to fonts differs quite a bit between Windows and Mac/Linux. This becomes especially apparent if you do end up installing something like extrafont. H/T R-Bloggers.

Comments closed

Power BI Report Iconography

Joe Billingham brings in the Unicode characters:

There are 143,859 Unicode characters available, everything from emojis, symbols, shapes and braille patterns to dice and playing cards. Whether you want to offer further insight into your data, enhance the user experience or simply create something sublimely ridiculous, with so many icons at your fingertips, the possibilities are only limited by your imagination.

Click through to see how you can include specific Unicode characters to create a visual link in the mind of your viewer to your data.

Comments closed