Press "Enter" to skip to content

Month: September 2021

Implicit Conversions and SARGability

Erik Darling bears bad news:

Data types are one of those core things you need to get right. Whether it’s matching types between join columns, or between parameters and predicates, not doing so can really squash application performance in quite similar ways to writing non-SARGable predicates.

That’s because — wait for it — a lot of the stuff we’ve talked about over the last week that can happen with poorly written predicates can happen with poorly matched data types, too.

Click through for an example. If this keeps up, we may never save Sarge.

Comments closed

Where Databases Fit in the Always-Valid Domain Model

Vladimir Khorikov asks an important question:

Today, we’ll talk about an important question: how does the application database fit into the concept of Always-Valid Domain Model?

In other words, is the database part of the always-valid boundary or should you consider it an external system and validate all data coming from it?

Pre-read, my answer was no, databases are part of the external world and your domain model needs to validate every time because who knows what weirdo did something to your data while it slept.

Post-read, well, you’ll have to read to find out.

Comments closed

Azure Database for PostgreSQL Replicas

Gauri Mahajan takes us through replica creation in Azure Database for PostgreSQL:

Azure Database for PostgreSQL is an Azure offering of the open-source Postgres database. As there are many databases and data warehouses that are derived from Postgres, during migration from Postgres to a different flavor of another database or data warehouse that is compatible with Postgres, often read replicas are employed. The replicas are read-only since it’s a one-way replication from the master database to replicas. And replicas serve the purpose of decreasing the load on the primary transactional database in production environments. Replicas are typically used as migration sources, reporting and ad-hoc analytics sources and for other purposes. Let’s go ahead and learn to create and manage read replicas in Azure Database for PostgreSQL.

Click through for the process.

Comments closed

Comparing Objects in Powershell

Phil Factor has a new cmdlet for us:

Whatever your development methodology, you need to make changes lightning fast, and the easiest way of doing that is to test frequently. If you are driving this work with PowerShell, which works well, you’ll want to compare the actual results of a process with the expected results. You’re keen to see what’s changed but will often have no idea what to look for beforehand. You need the broad view.

Fine. To do this, you need something that can tell you the differences between two objects. Yes, there is already a cmdlet to do that called Compare-Object. It is useful and ingenious, and works well for what is does, but it doesn’t do enough for our purposes. Let’s run through a few examples, just to explain why I need more for many of the things I do.

Read on to see where Compare-Object could be better and Phil’s solution to the problem.

Comments closed

Using tsoutliers() to Detect Time Series Outliers

Rob J. Hyndman shows off a function in the forecast package in R:

The tsoutliers() function in the forecast package for R is useful for identifying anomalies in a time series. However, it is not properly documented anywhere. This post is intended to fill that gap.

The function began as an answer on CrossValidated and was later added to the forecast package because I thought it might be useful to other people. It has since been updated and made more reliable.

Read on to see how it works. This is one of the reasons I like the R programming language so much for data analysis and statistics: usually, somebody smarter than me has already built a solution to the problem and it’s just a matter of finding the right function. H/T R-Bloggers

Comments closed

Solving the Knapsack Problem with PostgreSQL

Francesco Tisiot is packing for a trip:

People have had to pack luggage for a long time, so this optimization dilemma is far from new. It even has a name: the knapsack problem. It can be applied to a variety of use cases where there is a set of items with a defined weight (space occupied in the luggage in our example) and value (item benefits during holiday) and where the total weight is limited (luggage size).

The end goal is to come up with a set of items that fits within the weight constraint and has the maximum possible value.

Francesco provides us one possible solution to the problem. I like the knapsack problem a lot, but I like the Holyfield problem even more.

Comments closed

Indexed Views and SARGability

Erik Darling shows how you can create indexed views to make life easier when tuning queries:

There are some things that, in the course of normal query writing, just can’t be SARGablized. For example, generating and filtering on a windowing function, a having clause, or any other runtime expression listed here.

There are some interesting ways to use indexed views to our advantage for some of those things. While windowing functions and having clauses can’t be directly in an indexed view, we can give an indexed view a good definition to support them.

It won’t always work, but it is an option to keep in mind.

Comments closed

Accessing Network Shares from SQL Server

Daniel Hutmacher engages in chicanery:

Using a local service account for your SQL Server service, your server won’t automatically have permissions to access to other network resources like UNC paths. Most commonly, this is needed to be able to perform backups directly to a network share.

Using a domain account as your SQL Server service account will allow the server to access a network share on the same domain, but if the network share is not on your domain, like an Azure File Share, you need a different solution.

There’s a relatively easy way to make all of this work, though.

Click through to see how, as well as several methods to make it work within SQL Server.

Comments closed

Adding Report Names to the Log Analytics Report

Gilbert Quevauvilliers feels complete:

I was really excited to use the Power BI Log Analytics for Analysis Services Engine report when it was released along with this blog post from the Power BI Team: Announcing long-term usage and performance insights (Public Preview) | Microsoft Power BI Blog | Microsoft Power BI

This is really a great report when using Log Analytics.

I found the one thing that I wanted to view was my report names. The standard report did not have this.

Protip: displaying GUIDs is not the same as displaying useful information. I recommend reading through this just to see how much pain and effort it takes to make the Log Analytics report actually become useful.

Comments closed

Using Radar Charts

Mike Cisneros explains what radar (or spider) charts are and how they work:

A spider chart, also sometimes called a radar chart, is often used when you want to display data across several unique dimensions. Although there are exceptions, these dimensions are usually quantitative, and usually range from zero to a maximum value. Each dimension’s range is normalized to one another, so that when we draw our spider chart, the length of a line from zero to a dimension’s maximum value will be the same for every dimension.

Spider charts can be found in lots of industries, but rarely in large numbers. In our experience, they’re most likely to pop up in food science (comparing products across multiple different facets of taste, texture, etc.) and in sports analytics (comparing athletes across several dimensions of performance). In one of our previous #SWDchallenges, several participants found other use cases for spider charts, such as comparing series on a time-cycle, comparing the volume of searches for different terms, or even visualizing the motifs in a piece of music.

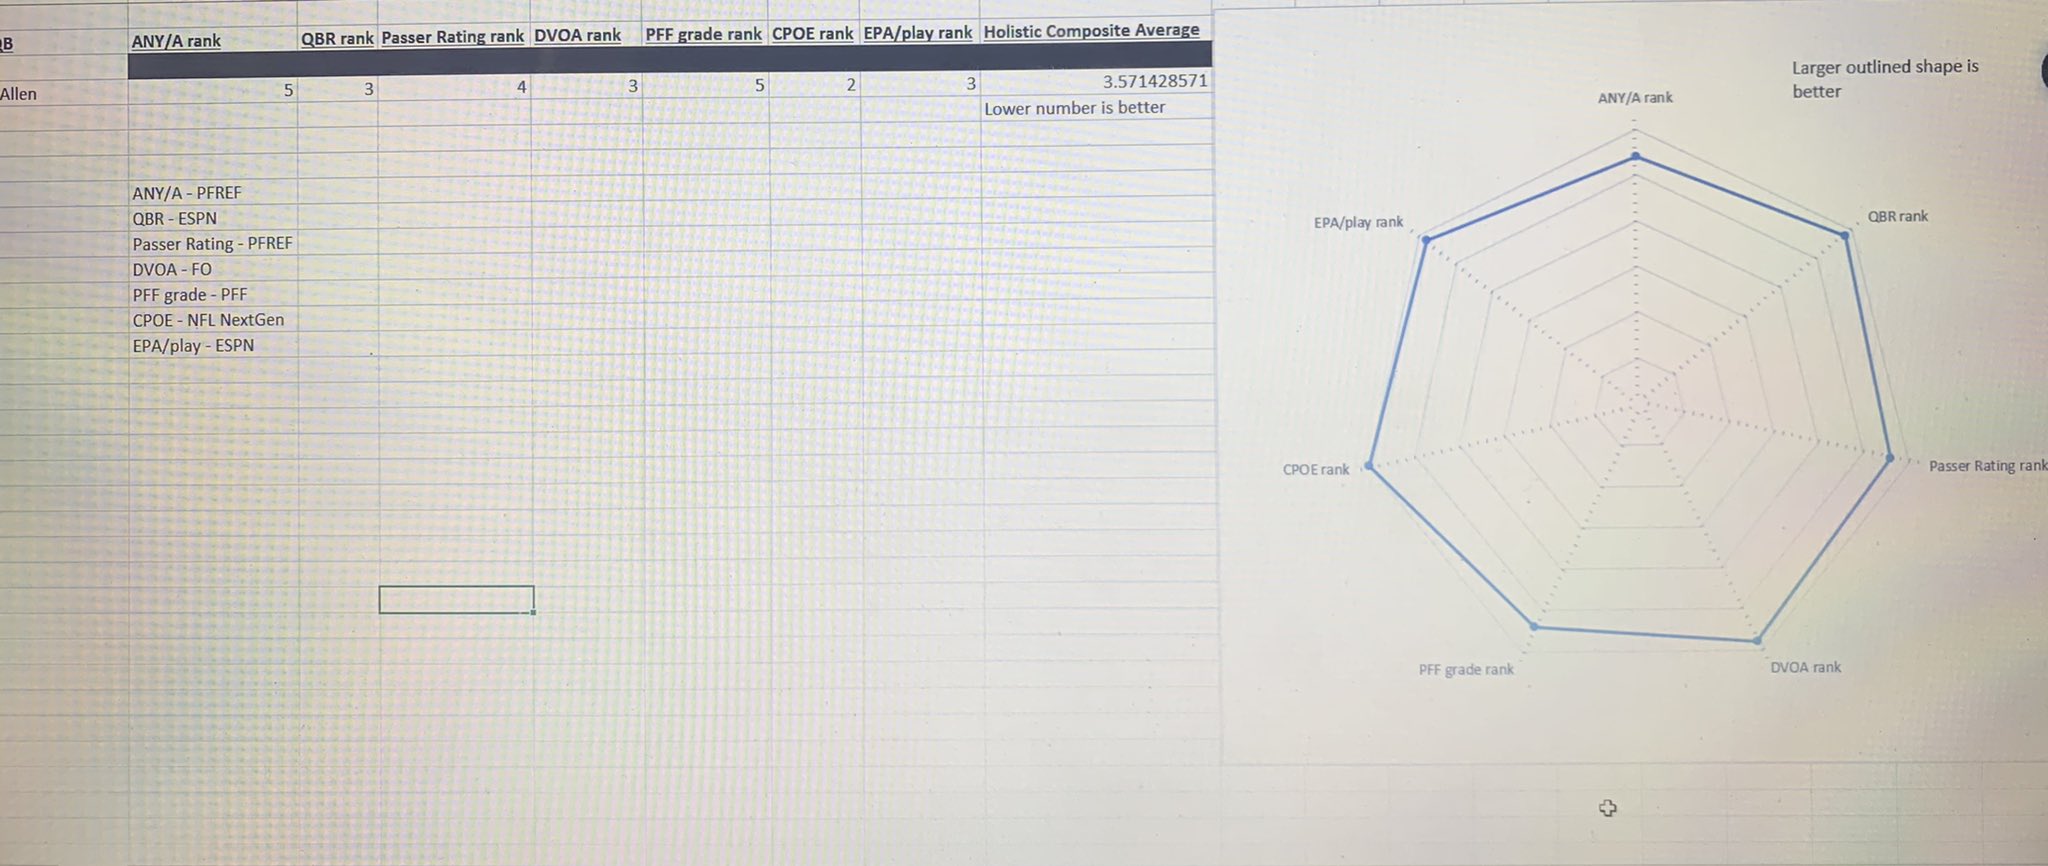
My favorite use of the radar chart was in the Madden NFL series, where I spent far too much of my youth comparing attributes between prospects—for example, the quarterback radar chart might have throwing power, throwing accuracy, speed, strength, and awareness. Then, you compare the relative sizes and spikes of players to gauge who would be better. (Except that in the case of Madden, it was all a lie—turns out the radar charts weren’t actually based on anything, so as usual, a youth wasted).

More recently, Bruce Nolan came up with a radar chart to visualize quarterback play across a set of complementary measures:
Image
Comments closed