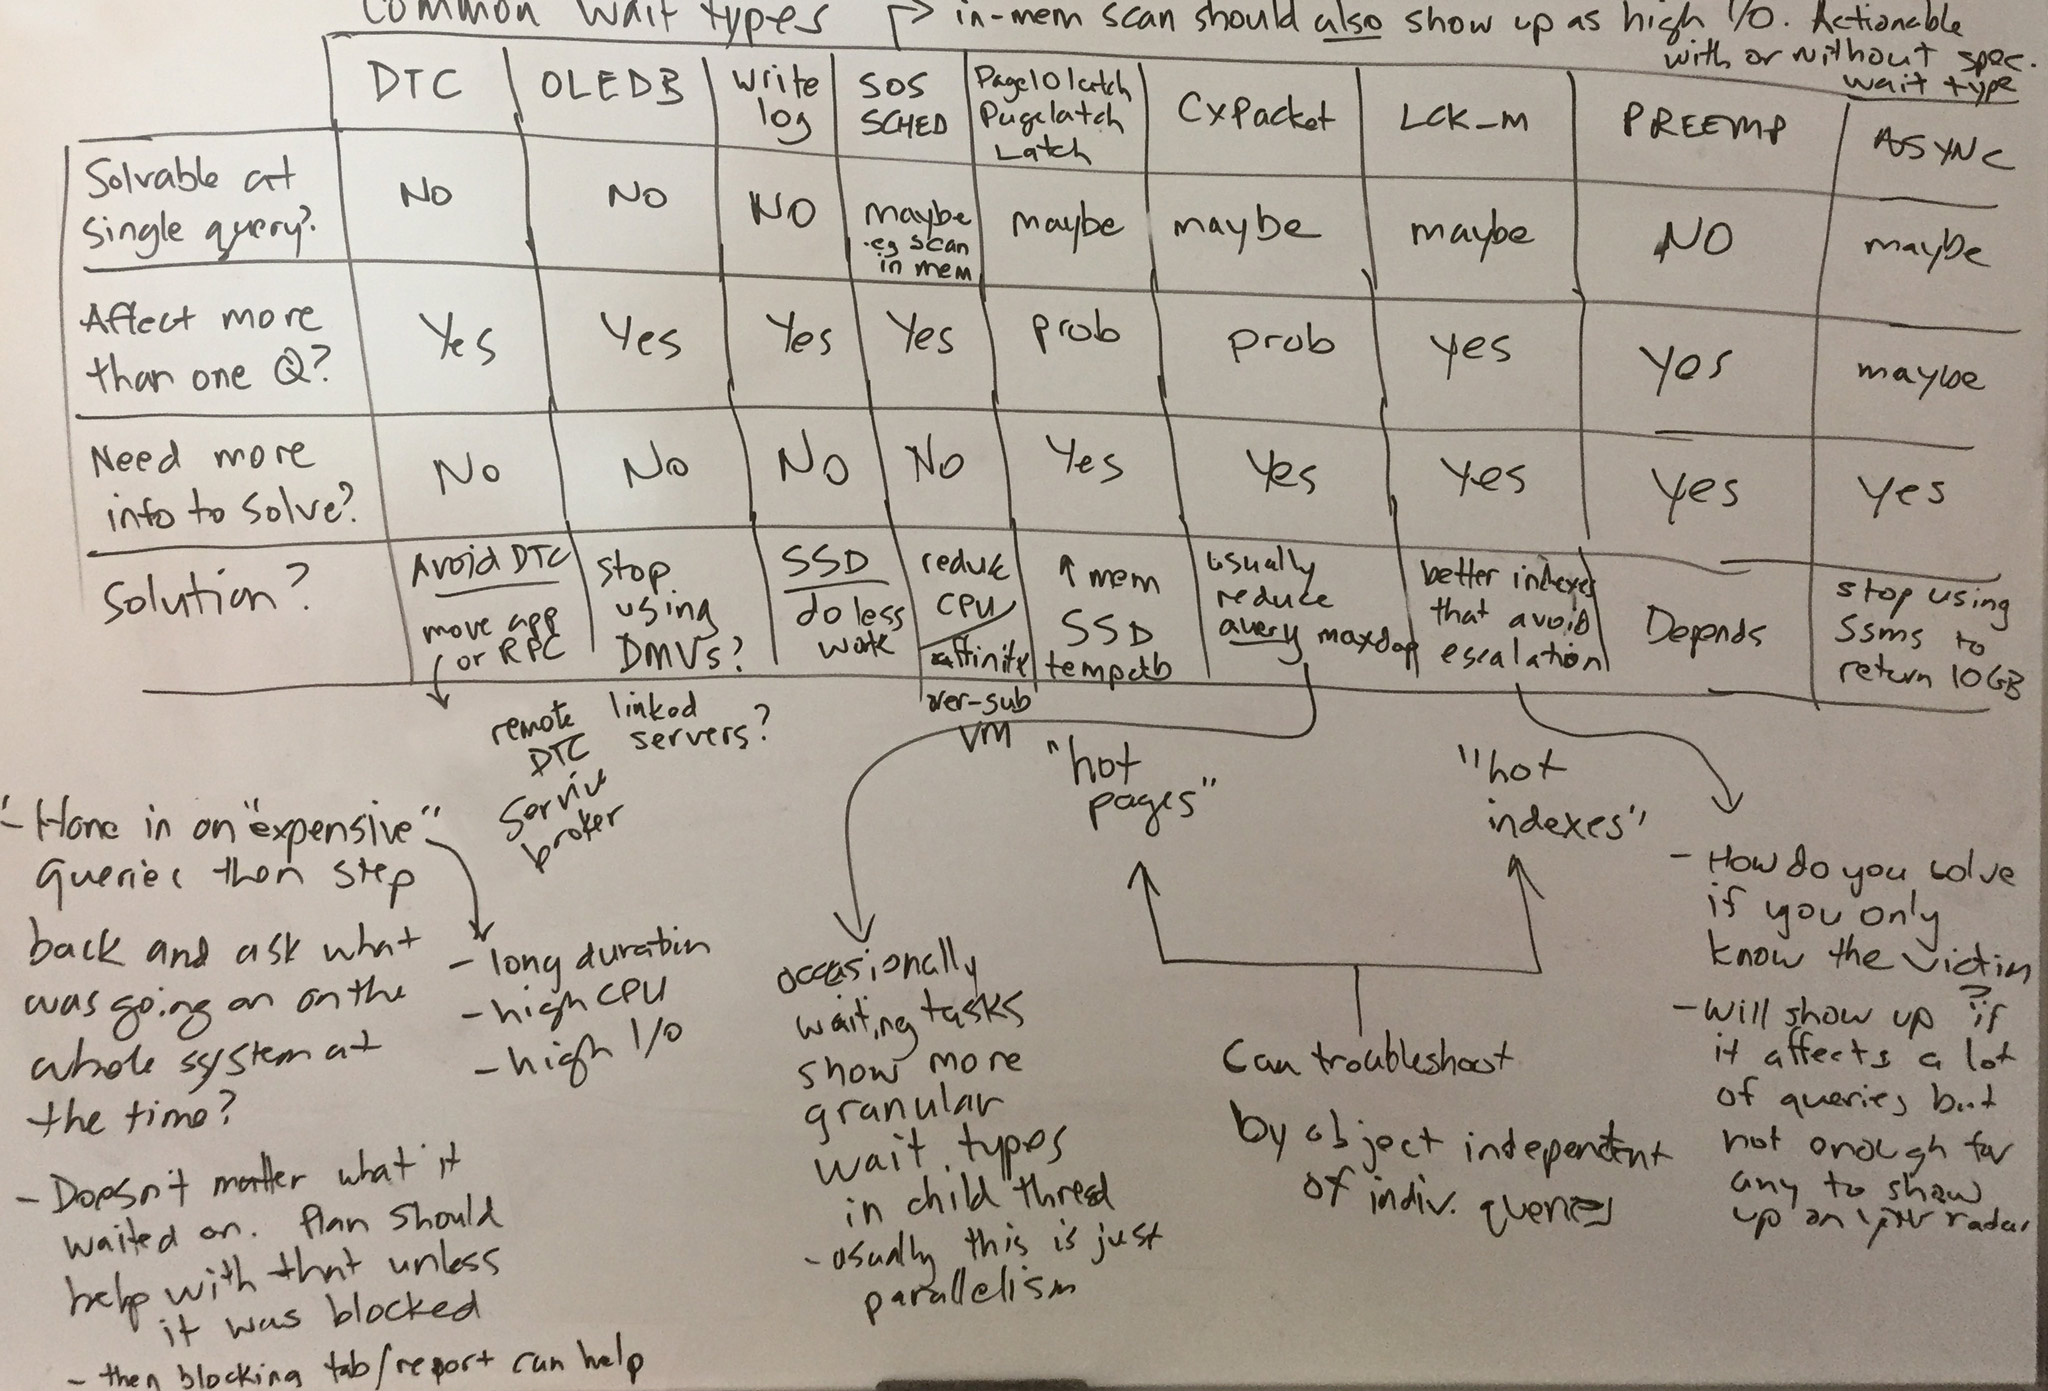
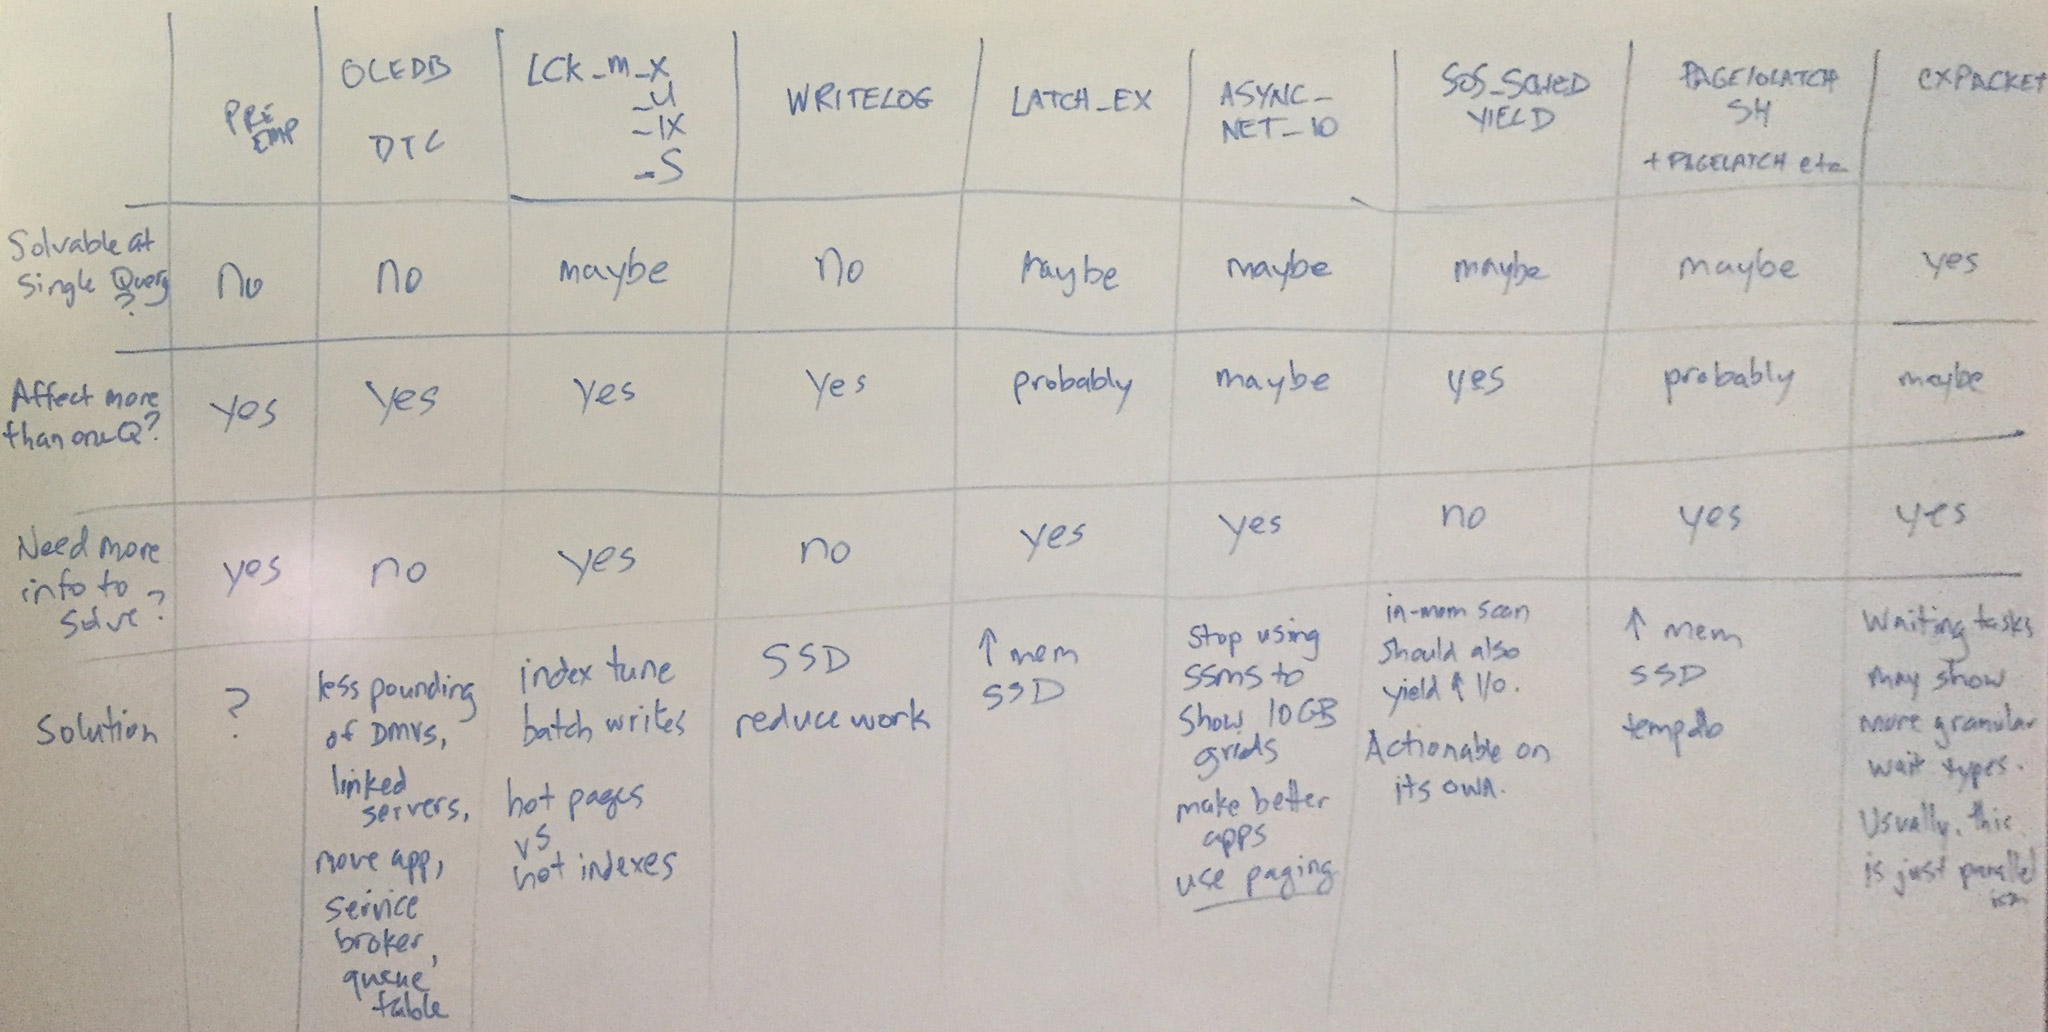
Press "Enter" to skip to content

Category: Wait Stats

Storing Wait Stats In tempdb

Max Vernon has a script which loads a bunch of wait stats definitions and then collects wait stat details:

Performance troubleshooting should begin with capturing wait stats so we can understand where SQL Server is busy. The script below captures wait stats into a table in tempdb; the script should be ran via a SQL Server Agent job or some other scheduling mechanism.

I like the definitions that Max provides.  My only recommendation would be to store this data someplace a bit more permanent than tempdb.

1 Comment

Wanted: Per-Database Wait Stat Collection Built In

Erik Darling wants configurable wait stat collections on a database level built into SQL Server:

I’m hoping that a feature like this could solve some intermediate problems that Query Store doesn’t.

Namely, being lower overhead, not collecting any PII, and not taking up a lot of disk space — after all, we’re not storing any massive stored proc text or query plans, here, just snapshots of wait stats.

This will help even if you’re already logging wait stats on your own. You still don’t have a clear picture of which database the problem is coming from. If you’ve got a server with lots of databases on it, figuring that out can be tough.

Understanding what waits (and perhaps bottlenecks) a single database is experiencing can also help admins figure out what kind of instance size they’d need as part of a migration, too.

It’s an interesting approach.  If you agree with Erik, go vote.

Comments closed

When Wait Stats Aren’t Enough

Joe Obbish has an example of diagnosing performance problems when wait stats don’t indicate any problems:

In summary, page allocations and page free events rapidly occur, sometimes in an alternating pattern. SQL Server will often free a number of pages just to immediately request allocations for a similar number of pages. If all of the free page events result in returned memory to the OS then the reason for the scalability bottleneck becomes clear. When running the full workaround with 96 concurrent sessions, a total of 341965 page freed operations were performed. Those events freed about 71.3 million pages in total. That amounts to about 584 GB of memory returned to the OS in total, based on the previous assumptions.

This is a great investigation into the depths of debugging in SQL Server.  Joe wasn’t able to get a definitive solution to his problem, but he showed us a lot along the way.

Comments closed

CLR_MANUAL_EVENT Waits

Jonathan Kehayias traces out the cause of CLR_MANUAL_EVENT waits on SQL Server:

The fact that no data has been collected for this type throughout a good cross-section of their customers really confirmed for me that this isn’t something that is commonly a problem, so I was intrigued by the fact that this specific workload was now exhibiting problems with this wait. I wasn’t sure where to go to further investigate the issue so I replied to the email saying I was sorry that I couldn’t help further because I didn’t have any idea what would be causing literally dozens of threads performing spatial queries to all of sudden start having to wait for 2-4 seconds at a time on this wait type.

A day later, I received a kind follow-up email from the person that asked the question that informed me that they had resolved the problem. Indeed, nothing in the actual application workload had changed, but there was a change to the environment that occurred. A third-party software package was installed on all of the servers in their infrastructure by their security team, and this software was collecting data at five-minute intervals and causing the .NET garbage collection processing to run incredibly aggressively and “go nuts” as they said. Armed with this information and some of my past knowledge of .NET development I decided I wanted to play around with this some and see if I could reproduce the behavior and how we could go about troubleshooting the causes further.

Read the whole thing if you use CLR.

Comments closed

HADR_DATABASE_WAIT_FOR_TRANSITION_TO_VERSIONING Wait Type

Chirag Shah explains what the HADR_DATABASE_WAIT_FOR_TRANSITION_TO_VERSIONING wait type really means:

Recently a customer reported an interesting issue, while querying against recently added readable replica, SELECT statement is shown as suspended and session is shown as waiting on HADR_DATABASE_WAIT_FOR_TRANSITION_TO_VERSIONING

[…]

Upon more investigation, it appeared to be waiting on with a wait type HADR_DATABASE_WAIT_FOR_TRANSITION_TO_VERSIONING

The behavior is by design as mention in the SQL Server product documentation and applicable to all version of SQL Server that supports availability group.

Read on for the explanation.

Comments closed

FCB_REPLICA_SYNC Spinlock Explanation

Paul Randal explains what the FCB_REPLICA_SYNC spinlock is and what it does:

In a nutshell, this spinlock is used to synchronize access to the list of pages that are present in a database snapshot, as follows:

  • If a page in a database with one or more database snapshots is being updated, check each snapshot’s list to see if the page is already in the snapshot. If yes, nothing to do. If no, copy the pre-change image of the page into the snapshot.
  • If a query is reading a page in the context of a database snapshot, check the list of pages to see whether to read from the snapshot or the source database.

This synchronization ensures that the correct copy of a page is read by a query using the snapshot, and that updated pages aren’t copied to the snapshot more than once.

The original question was because the person was seeing trillions of spins for the FCB_REPLICA_SYNC spinlock. That’s perfectly normal if there’s at least one database snapshot, a read workload on the snapshot, and a concurrent heavy update workload on the source database.

Great information.  And a good reminder that if you are using database snapshots in SQL Server, you generally don’t want to have more than one on the same database.

Comments closed

Understanding NESTING_TRANSACTION_FULL

Joe Obbish digs into the NESTING_TRANSACTION_FULL latch, explains what it does, and shows how it might be a performance bottleneck:

We know that only one worker can get the exclusive latch for the transaction at a time. Let’s use a greatly simplified model for what each parallel worker does for this query. It reads a row, does processing for a row, and goes on to the next one. Once it has enough rows to write out a log record it tries to acquire the latch. If no one else has the latch in exclusive mode it can get the latch, update some structure in the parent transaction, release the latch, and continue reading rows. If another worker has the latch in exclusive mode then it adds itself to the FIFO wait queue for the latch subresource and suspends itself. When the resource is available the worker status changes from SUSPENDED to RUNNABLE. When it changes again from RUNNABLE to RUNNINGit acquires the latch, updates some structure in the parent transaction, releases the latch, and continues working until it either needs to suspend again or hits the end of its 4 ms quantum. When it hits the end of its 4 ms quantum it will immediately select itself to run again because there are no other runnable workers on the scheduler.

So what determines the level of contention? One important factor is the number of workers that are contending over the same subresource. For this latch and type of query (rows are pretty evenly distributed between worker threads), this is simply MAXDOP. There’s a tipping point for this query where adding more workers is simply counterproductive.

For years I’ve seen people in the community state that running queries at MAXDOPthat’s too high can be harmful. I’ve always been after simple demos that show why that can happen. The NESTING_TRANSACTION_FULL latch is an excellent example of why some queries run longer if MAXDOP is increased too far. There’s simply too much contention over a shared resource.

Read the whole thing.

Comments closed

The CXCONSUMER Wait Type

Paul Randal explains the CXCONSUMER wait type:

Back in September 2016 I created a Connect item (3102145) to split the CXPACKET wait into benign and actionable waits, so that when a CXPACKET wait happens, there’s really something to investigate. Unfortunately the Connect website has been shut down by Microsoft so I can’t point you to the original request I made (I also tried in the Internet Archive but couldn’t find it).

The reason I wanted this change is that CXPACKET waits have always been registered by both producer and consumer threads for query plan operators where some threads produce data (i.e. producer threads) and some threads consume the produced data (i.e. consumer threads). However, the waits for the consumer threads are not actionable, because it’s the *producer* threads that are the cause of the consumer thread waits, and so it’s the producer thread waits that are actionable. By splitting the consumer waits out, the number of CXPACKET waits should be reduced, and those that are left should be investigated.

During the PASS Summit in 2017, my friend Pedro Lopes (b|t) on the Tiger Team announced that they’d made the change. The new wait type, CXCONSUMER, was initially added to SQL Server 2017 RTM CU3 and was added to SQL Server 2016 SP2 in April. You can read Pedro’s blog post here. Note that there was initially a bug with the implementation which was fixed in SQL Server 2017 RTM CU4.

It’s nice to see this split, as CXPACKET has been one of the most ambiguous wait types for a while, due to it having multiple potential meanings.

Comments closed

Getting Wait Info From Extended Events

Grant Fritchey shows how to get wait information for particular sessions from the system_health extended event:

On your servers, any of them that are SQL Server 2008 or newer, right now, unless you’ve performed actions to prevent this, you’re running the Extended Events system_health session. It’s just happening, currently, on all your servers. Nothing you need to do about it at all. I’ll be a lot of you never even knew it was there.

If you follow the link you can see all the various types of information being gathered by the Extended Event system_health session. I won’t detail all of it here. Let me just provide a little context around how the session works. First and foremost, similar to the error log, this session consists of four files, each 5mb in size, rolling over as they get filled. For systems with a very high degree of activity, that means the information here may only be hours old. However, for most of us, this provides days, if not weeks worth of information about the behavior of your system.

The system_health extended event misses a lot of stuff, but it’s quite useful when you don’t have a purpose-built monitoring solution in place.

Comments closed